Fig. 4
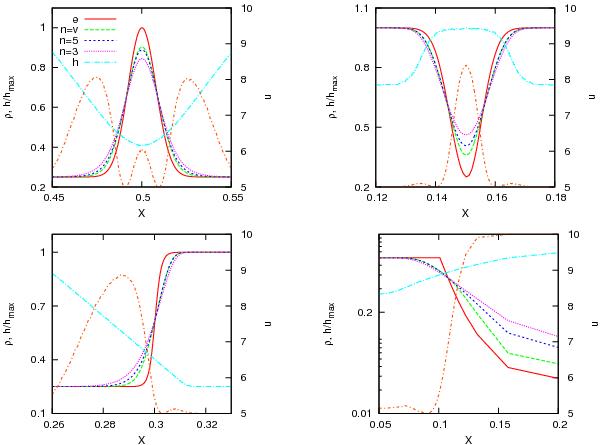
Fitting of several 1D density profiles using the sinc family of kernels with constant and self-adaptive indexes. The upper left panel shows a Gaussian, mountain-like, profile. The exact (e) analytical value is shown in red, the result with the variable (v) kernel index, constant n = 5 and n = 3 in green, blue, and pink, respectively. The light blue line shows the profile of the smoothing-length normalized to its highest value (achieved just at the limits of the system, x = 0 and x = 1). The orange line shows the profile of the kernel index n associated with the green line. The same applies to the upper right (valley), the bottom left (wall), and the bottom right (cliff) profiles.
Current usage metrics show cumulative count of Article Views (full-text article views including HTML views, PDF and ePub downloads, according to the available data) and Abstracts Views on Vision4Press platform.
Data correspond to usage on the plateform after 2015. The current usage metrics is available 48-96 hours after online publication and is updated daily on week days.
Initial download of the metrics may take a while.