Fig. 3
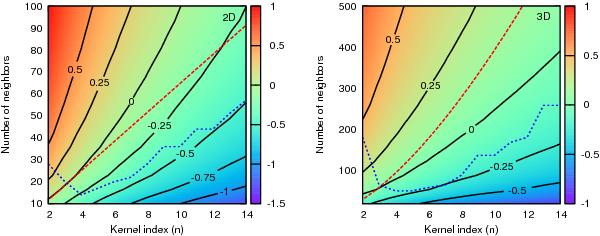
Color map of the logarithm of the error in density estimation in 2D (left) and 3D (right) as a function of the kernel index and number of neighbors (see Sect. 3 for a complete explanation of this diagram). The dashed line in red is the rough critical limit separating the region susceptible to particle pairing (above the line). The blue dotted line denotes the region where the approach of integrals by summations in density calculation is too sensitive to particle distribution (below the line).
Current usage metrics show cumulative count of Article Views (full-text article views including HTML views, PDF and ePub downloads, according to the available data) and Abstracts Views on Vision4Press platform.
Data correspond to usage on the plateform after 2015. The current usage metrics is available 48-96 hours after online publication and is updated daily on week days.
Initial download of the metrics may take a while.