Fig. 17
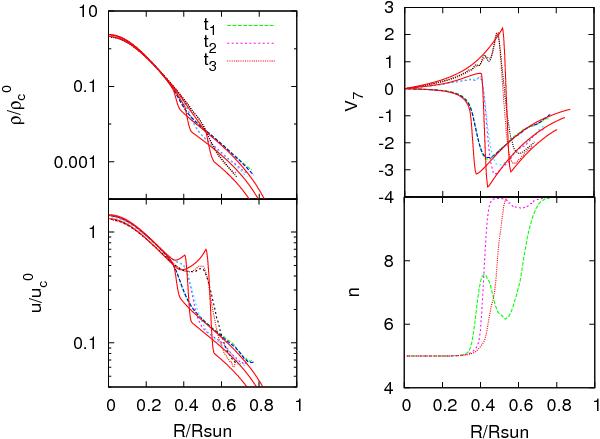
Profiles of density, velocity (in units of 107 cm s-1), internal energy, and index of the sinc kernel at times t1 = 870 s, t2 = 1086 s, t3 = 1311 s, corresponding to the collapse of a Sun-like polytrope. The lines in green, pink, and orange are for n adaptive and the blue, light blue, and black lines for n = 5 at the same elapsed times. The continuum lines in red have been obtained using a Lagrangian hydrocode with spherical symmetry.
Current usage metrics show cumulative count of Article Views (full-text article views including HTML views, PDF and ePub downloads, according to the available data) and Abstracts Views on Vision4Press platform.
Data correspond to usage on the plateform after 2015. The current usage metrics is available 48-96 hours after online publication and is updated daily on week days.
Initial download of the metrics may take a while.