Fig. 16
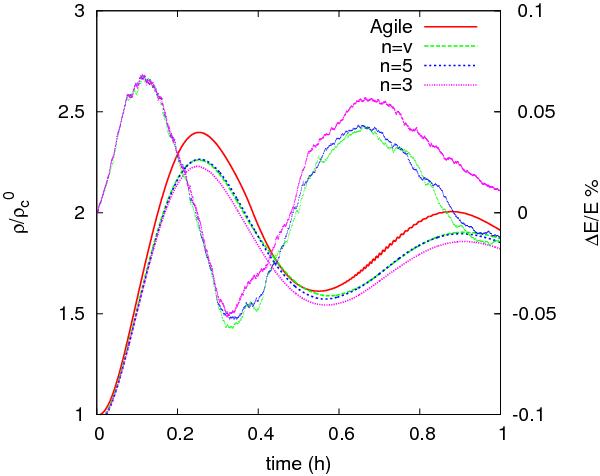
Trajectory of the central density during the implosion of a Sun-like polytrope and percent of energy conservation during the first elapsed hour. The red continuum line is the 1D calculation with the implicit Lagrangian hydrocode AGILE. Dashed lines are for n = 3, n = 5, and n adaptive. Light continuum lines in pink, blue and green show the percent of energy conservation.
Current usage metrics show cumulative count of Article Views (full-text article views including HTML views, PDF and ePub downloads, according to the available data) and Abstracts Views on Vision4Press platform.
Data correspond to usage on the plateform after 2015. The current usage metrics is available 48-96 hours after online publication and is updated daily on week days.
Initial download of the metrics may take a while.