Fig. 2
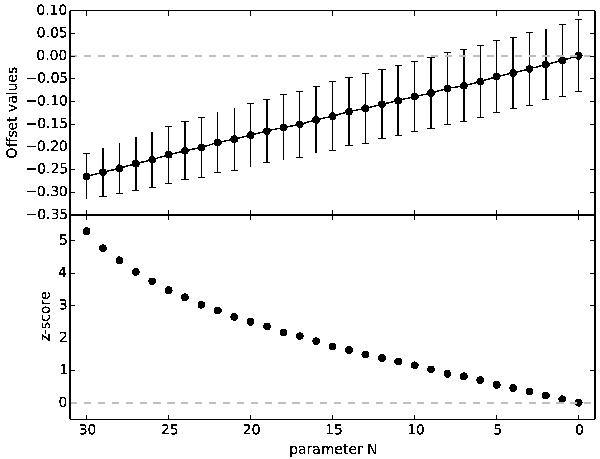
The result of poluting a mock planet-host sample with comparison stars following the procedure described in Sect. 5.2. Upper panel: dependence of the average offset and associated dispersion on the number N of planet-host stars in the mock planet-host star population of 30 stars. Lower panel: z-score of the offset as calculated relative to zero as a function of the same parameter N. The dashed line is a visual aid, representing an offset of zero on the upper panel and a z-score of zero in the lower one.
Current usage metrics show cumulative count of Article Views (full-text article views including HTML views, PDF and ePub downloads, according to the available data) and Abstracts Views on Vision4Press platform.
Data correspond to usage on the plateform after 2015. The current usage metrics is available 48-96 hours after online publication and is updated daily on week days.
Initial download of the metrics may take a while.