Fig. 6
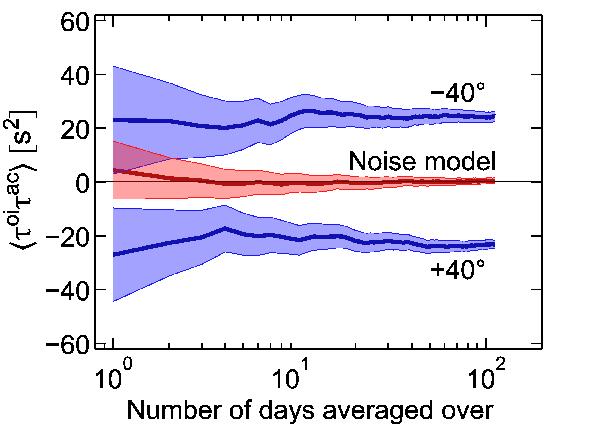
Product ⟨ τoiτac ⟩ as a function of days of data averaged over, for f-mode-filtered HMI observations at − 40° and 40° latitude as well as τac computed for the noise model. The filled areas denote the 3σ estimates. All data have been averaged over space (about 180 × 180 Mm2), four angles β and three 8 h datasets per day.
Current usage metrics show cumulative count of Article Views (full-text article views including HTML views, PDF and ePub downloads, according to the available data) and Abstracts Views on Vision4Press platform.
Data correspond to usage on the plateform after 2015. The current usage metrics is available 48-96 hours after online publication and is updated daily on week days.
Initial download of the metrics may take a while.