Fig. 4
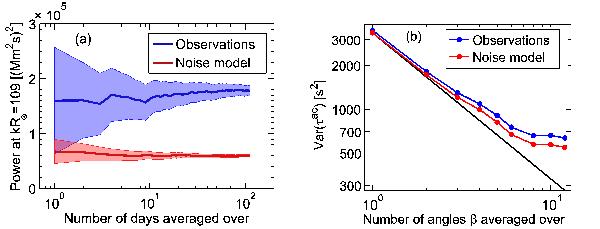
a) Azimuthally averaged power of HMI and noise-model τac maps (average maps over four angles β) at kR⊙ = 109, as a function of days of data averaged over (the same data as in Fig. 3 were used). The power was averaged over three 8 h datasets per day. The filled areas denote the 3σ error estimates. b) Variance of τac measurements computed from both HMI and noise-model f-mode-filtered data at the solar equator. The observation time of the datasets is 8 h and their spatial size is about 180 × 180 Mm2. The variance is shown as a function of the number of angles β over which the data is averaged. For reference, the black line shows Var(τac) ∝ 1 /nβ.
Current usage metrics show cumulative count of Article Views (full-text article views including HTML views, PDF and ePub downloads, according to the available data) and Abstracts Views on Vision4Press platform.
Data correspond to usage on the plateform after 2015. The current usage metrics is available 48-96 hours after online publication and is updated daily on week days.
Initial download of the metrics may take a while.