Fig. 3
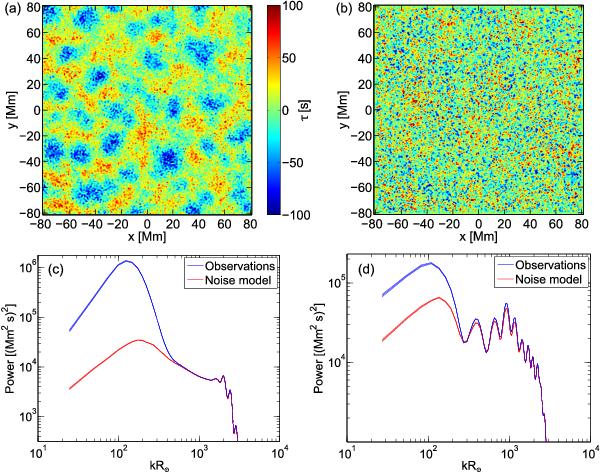
a) Example HMI τoi travel-time map for one f-mode-filtered 8 h dataset centered at the solar equator and annulus radius Δ = 10 Mm. The coordinate x is in the west direction and y in the north direction. The travel times have been measured using the linearized definition in Gizon & Birch (2004). The color scale has been truncated to increase the contrast. The minimum and maximum values are −152.4 s and 117.3 s. b) Example τac travel-time map for the same dataset as in a) with Δ = 10 Mm and n = 6, averaged over the four angles β. The minimum and maximum values are − 149.7 s and 144.8 s. c) Power spectrum of τoi for both HMI data and noise model (Gizon & Birch 2004), averaged over azimuth and 336 × 8 h datasets (size about 180 × 180 Mm2) centered at the solar equator, plotted versus the product of horizontal wavenumber k and solar radius R⊙. The thickness of the lines denotes the 1σ error. d) Power spectrum of τac for both HMI data and noise model, averaged over azimuth and 336 × 8 h datasets. The τac maps were averaged over four angles β before computing the power.
Current usage metrics show cumulative count of Article Views (full-text article views including HTML views, PDF and ePub downloads, according to the available data) and Abstracts Views on Vision4Press platform.
Data correspond to usage on the plateform after 2015. The current usage metrics is available 48-96 hours after online publication and is updated daily on week days.
Initial download of the metrics may take a while.