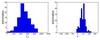
Fig. 5
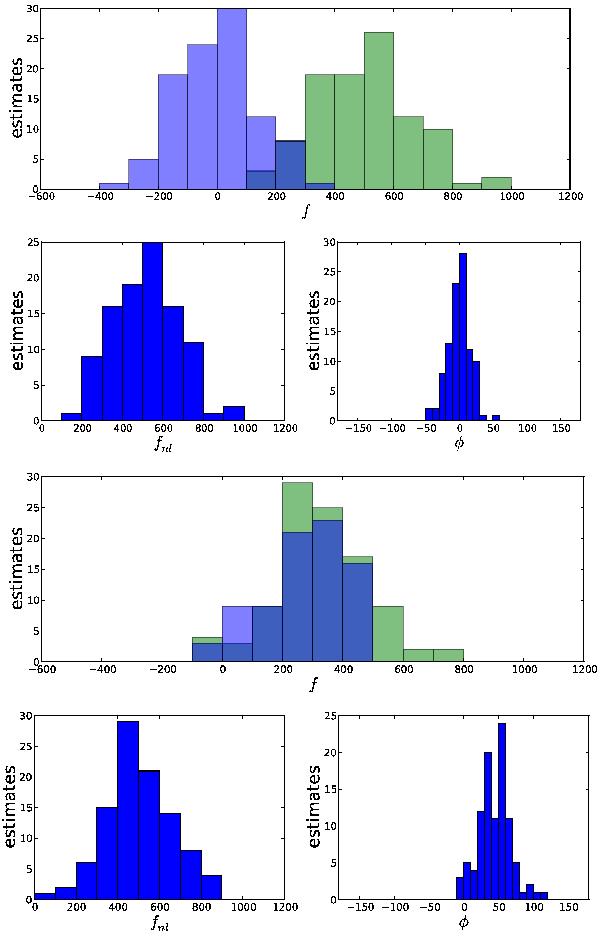
Parameter estimation histograms for 100 maps with linear model non-Gaussianity with kc = 0.01 and lmax = 1000. The maps were created with fNL = 500 and φ = 0° (first two rows) and φ = 45° (rows three and four). Top: reconstructed f1 (green) and f2 (blue) amplitudes for φ = 0°. Second row: corresponding reconstructed amplitudes fNL and phases φ. Third and fourth row: same as above but with phase φ = 45°.
Current usage metrics show cumulative count of Article Views (full-text article views including HTML views, PDF and ePub downloads, according to the available data) and Abstracts Views on Vision4Press platform.
Data correspond to usage on the plateform after 2015. The current usage metrics is available 48-96 hours after online publication and is updated daily on week days.
Initial download of the metrics may take a while.