Fig. 3
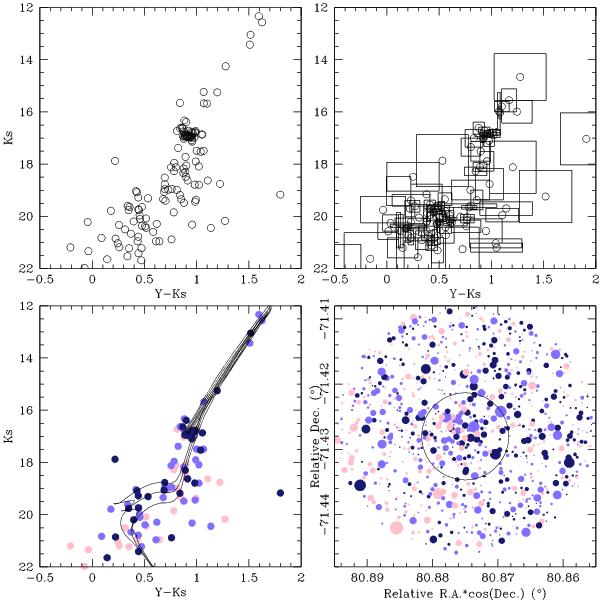
CMDs for stars in the field SL 435 (LMC 5_5): the observed CMD for the stars distributed within the cluster radius (top left panel); a field CMD for an annulus centred on the cluster, with an internal radius 3 times the cluster radius and an area equal to that of the cluster area (top right panel); the cleaned cluster CMD (bottom left). We overplotted box-shaped cells for each star in the field CMD to be used in the cluster CMD field decontamination (see section 4 for details). Colour-scaled symbols represent stars that statistically belong to the field (P ≤ 25%, pink), stars that might belong either to the field or to the cluster (P = 50%, light blue), and stars that predominantly populate the cluster region (P ≥ 75%, dark blue). Three isochrones from Marigo et al. (2008) for log (t/yr), log (t/yr) ± 0.1, and metallicity values listed in Table 1 are also superimposed. The schematic chart centred on the cluster for a circle of radius 3 times the cluster radius is shown in the bottom right panel. The black circle represents the adopted cluster radius. Symbols are as in the bottom left panel and with a size proportional to the brightness of the star. North is upwards, and east is to the left.
Current usage metrics show cumulative count of Article Views (full-text article views including HTML views, PDF and ePub downloads, according to the available data) and Abstracts Views on Vision4Press platform.
Data correspond to usage on the plateform after 2015. The current usage metrics is available 48-96 hours after online publication and is updated daily on week days.
Initial download of the metrics may take a while.