Fig. 7
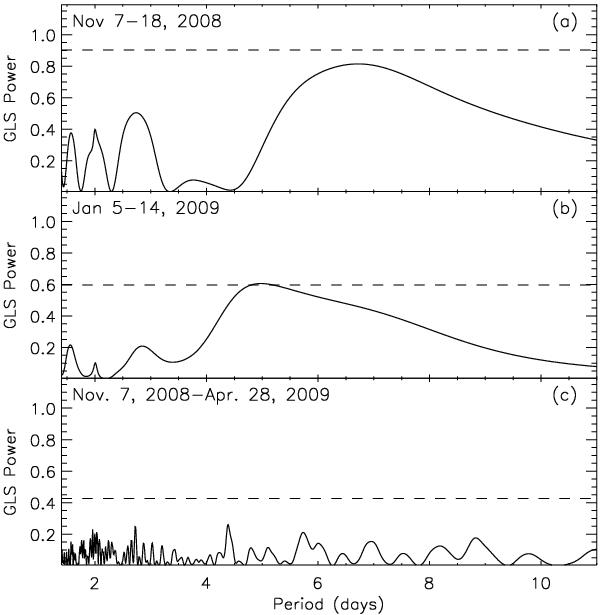
a) Generalized Lomb-Scargle periodogram of the RV residuals of GW Ori during Nov. 7–11, 2008. b) The same periodogram for the RV residuals but for data obtained during Jan. 5–14, 2009. c) Same as in panels a), b) but for data taken between Nov. 7, 2008 and Apr. 28, 2009. The dashed line in each panel indicates the power level for an FAP of 0.01, as computed by GLS.
Current usage metrics show cumulative count of Article Views (full-text article views including HTML views, PDF and ePub downloads, according to the available data) and Abstracts Views on Vision4Press platform.
Data correspond to usage on the plateform after 2015. The current usage metrics is available 48-96 hours after online publication and is updated daily on week days.
Initial download of the metrics may take a while.