Fig. 21
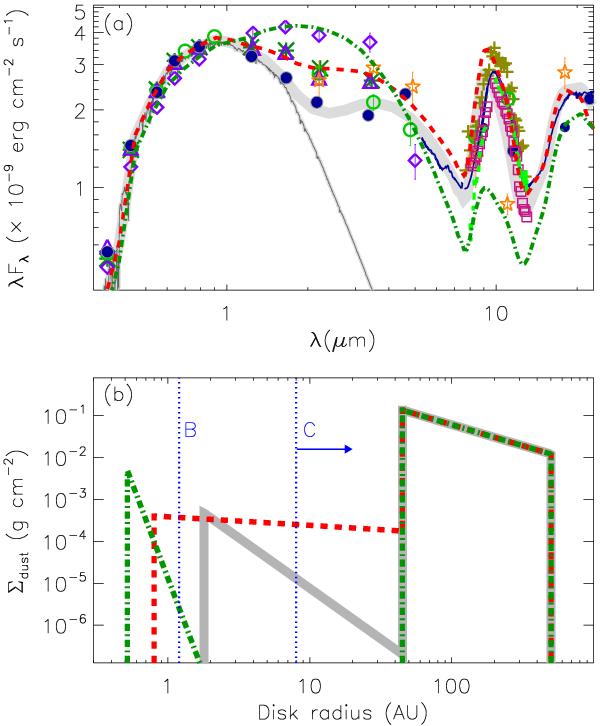
a) SEDs of GW Ori constructed with the data observed at different epochs. Significant variations can be seen in the SED of GW Ori at near-infrared bands. Open stars mark the observations obtained at November 1971 (Cohen 1973). Open circles mark the data from November 1974 (Cohen & Schwartz 1976). Asterisks display the data from December 1981 (Rydgren & Vrba 1983). Open diamonds and triangles show the average photometry from December 1984 and December 1986, respectively (Bouvier et al. 1988). Plus symbols around 10 μm show the data obtained on December 1978 (Cohen 1980), and the dashed lines around 10 μm display the data obtained on December 2002 (Przygodda et al. 2003). The open boxes around 10 μm show the data observed on March 2005 (Schegerer et al. 2009). Other symbols are the same as shown in Fig. 19. The thick gray curve shows calculated SED from Type 1; the dashed line for the SED from Type 2, and the dash-dotted line for the SED from Type 3. b) Surface density profiles for the dust in three model disks shown in panel a). The thick gray lines are for Type 1; the dashed lines are for Type 2, and the dash-dotted lines are for Type 3. The locations of two companions in GW Ori are also marked. The right-pointing arrow means that the separation for from GW Ori C to the primary is a lower limit.
Current usage metrics show cumulative count of Article Views (full-text article views including HTML views, PDF and ePub downloads, according to the available data) and Abstracts Views on Vision4Press platform.
Data correspond to usage on the plateform after 2015. The current usage metrics is available 48-96 hours after online publication and is updated daily on week days.
Initial download of the metrics may take a while.