Free Access
Fig. 2
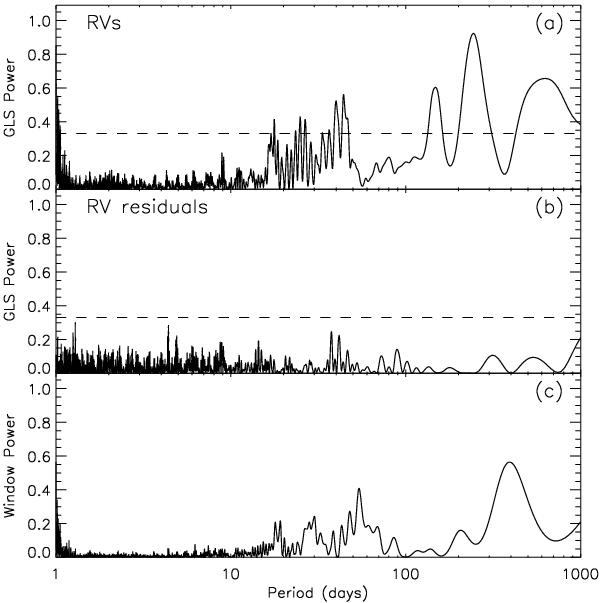
a) Generalized Lomb-Scargle periodogram of the RV measurements of GW Ori. b) Generalized Lomb-Scargle periodogram for the RV residuals after subtracting a one-companion fit. c) Window function. The dashed lines in panels a), b) indicate the power level for an FAP of 0.01, as computed by GLS.
Current usage metrics show cumulative count of Article Views (full-text article views including HTML views, PDF and ePub downloads, according to the available data) and Abstracts Views on Vision4Press platform.
Data correspond to usage on the plateform after 2015. The current usage metrics is available 48-96 hours after online publication and is updated daily on week days.
Initial download of the metrics may take a while.