Fig. 19
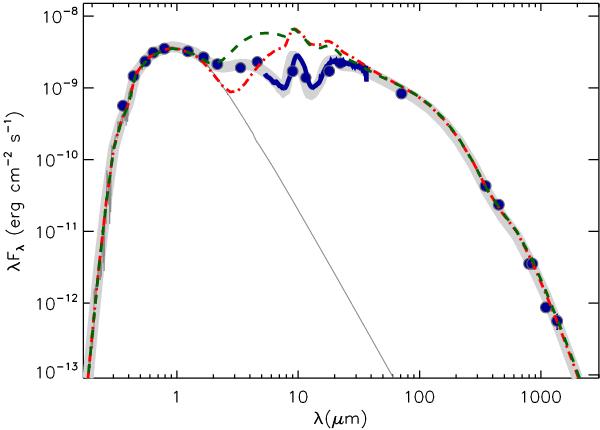
Observed SED of GW Ori. The broad band photometry is shown with the filled circles, and the IRS spectrum of this source is displayed in solid line. The thick gray line shows a best-fit model. The dashed line shows the model SED for a disk with Mdisk = 0.14 M⊙, Hout/Rout = 0.235, and Rin = 2.3 AU, and the dot-dashed line display another model SED for a disk with Mdisk = 0.14 M⊙, Hout/Rout = 0.2, and Rin = 8 AU. The photospheric emission level is indicated with a thin gray curve.
Current usage metrics show cumulative count of Article Views (full-text article views including HTML views, PDF and ePub downloads, according to the available data) and Abstracts Views on Vision4Press platform.
Data correspond to usage on the plateform after 2015. The current usage metrics is available 48-96 hours after online publication and is updated daily on week days.
Initial download of the metrics may take a while.