Fig. 18
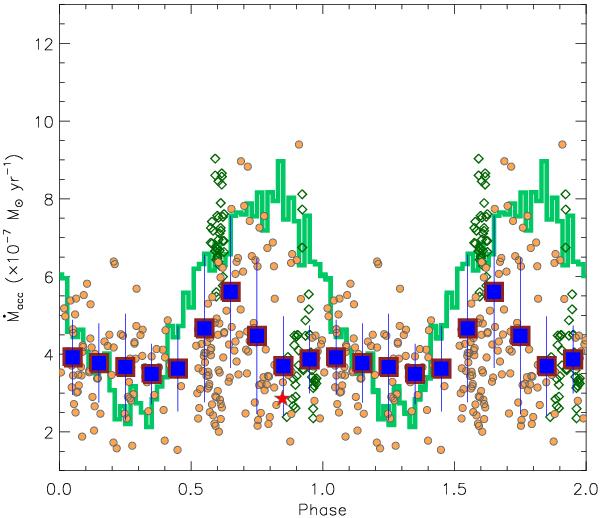
Accretion rates derived from U-band excesses of GW Ori, as plotted over the orbital phases of GW Ori B. The filled circles show the accretion rates estimated from the data in Grankin et al. (2007); the open diamonds are for the accretion rates derived from the data in Bouvier et al. (1988), and the star symbol mark the accretion rate from Calvet et al. (2004). We divide the orbital phases into different bins and show the mean value of accretion rates in each bin with a filled square, as well as its standard deviation with an error bar. The solid line show theoretical prediction for the total accretion rate of a close binary system in the low-eccentricity case from Artymowicz & Lubow (1996). The theoretical result have been arbitrarily scaled to compare with the observations.
Current usage metrics show cumulative count of Article Views (full-text article views including HTML views, PDF and ePub downloads, according to the available data) and Abstracts Views on Vision4Press platform.
Data correspond to usage on the plateform after 2015. The current usage metrics is available 48-96 hours after online publication and is updated daily on week days.
Initial download of the metrics may take a while.