Fig. 14
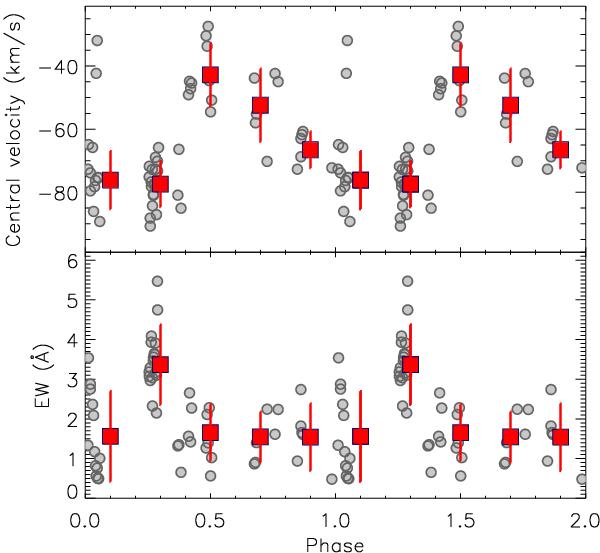
a) Central velocities of the disk wind components from the decomposition of Hα line profiles, as plotted over the orbital phases of GW Ori B. The velocity is in the rest frame of GW Ori. We divide the orbital phases into different bins and show the mean value of central velocities in each bin with a filled square and its standard deviation with an error bar. b) EWs of the disk wind components, as shown in panel a), plotted over the orbital phases of GW Ori B. We divide the orbital phases into different bins and show the mean value of EWs in each bin with a filled square and its standard deviation with an error bar.
Current usage metrics show cumulative count of Article Views (full-text article views including HTML views, PDF and ePub downloads, according to the available data) and Abstracts Views on Vision4Press platform.
Data correspond to usage on the plateform after 2015. The current usage metrics is available 48-96 hours after online publication and is updated daily on week days.
Initial download of the metrics may take a while.