Fig. 6
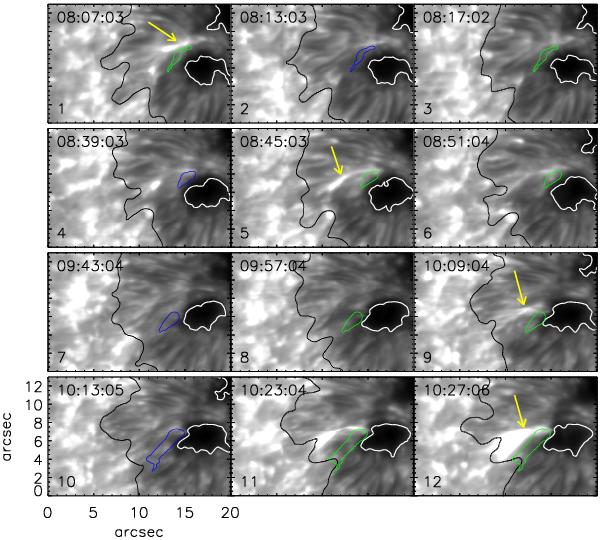
Chromospheric response to photospheric blueshifts. The four rows correspond to SP scans 1, 2, 4, and 5, respectively. The blue contour represents the BSF at the time when the SP slit was above the feature while the green contour represents the same at other instances of time. See text for description of yellow arrows. The white and black contours correspond to the umbral and penumbral areas, respectively, determined from the G-band intensity.
Current usage metrics show cumulative count of Article Views (full-text article views including HTML views, PDF and ePub downloads, according to the available data) and Abstracts Views on Vision4Press platform.
Data correspond to usage on the plateform after 2015. The current usage metrics is available 48-96 hours after online publication and is updated daily on week days.
Initial download of the metrics may take a while.