Fig. 4
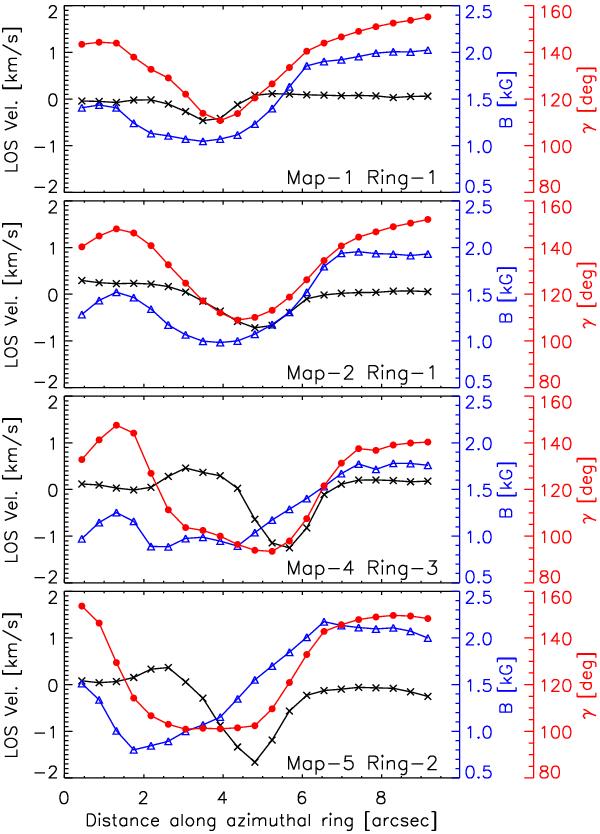
Variation of parameters along selected azimuthal cuts shown in Fig. 2 for different SP maps. The black line with crosses corresponds to the LOS velocity depicted on the left y-axis, while field strength and inclination are shown in blue triangles and red circles, respectively, and indicated on the right y-axis. The left-most pixel on the x-axis corresponds to the top of the azimuthal cut.
Current usage metrics show cumulative count of Article Views (full-text article views including HTML views, PDF and ePub downloads, according to the available data) and Abstracts Views on Vision4Press platform.
Data correspond to usage on the plateform after 2015. The current usage metrics is available 48-96 hours after online publication and is updated daily on week days.
Initial download of the metrics may take a while.