Fig. 3
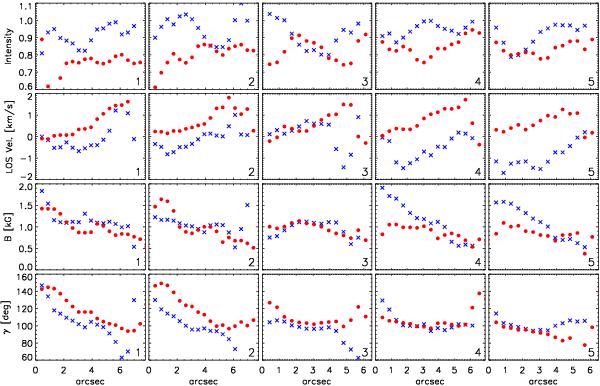
Variation of parameters along the two radial lines passing through the blue- and redshifted features in Fig. 2. Time increases from left to right as indicated by the number in the bottom right corner, while the blue crosses and red circles correspond to the radial cuts along the blue- and redshifted features, respectively. The left-most point on the x-axis corresponds to the upper end of the radial cut.
Current usage metrics show cumulative count of Article Views (full-text article views including HTML views, PDF and ePub downloads, according to the available data) and Abstracts Views on Vision4Press platform.
Data correspond to usage on the plateform after 2015. The current usage metrics is available 48-96 hours after online publication and is updated daily on week days.
Initial download of the metrics may take a while.