Fig. 2
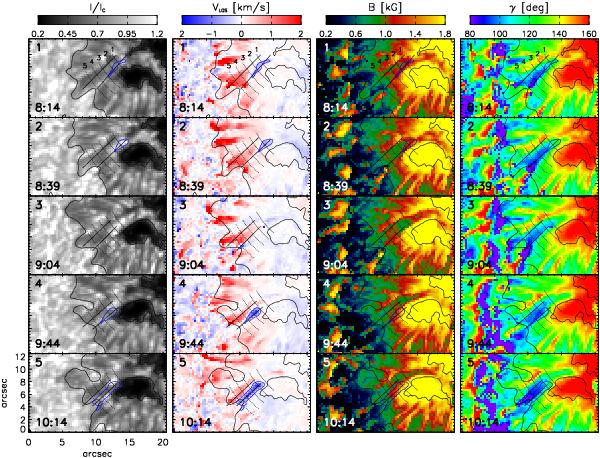
Temporal evolution of physical parameters. From left to right: G-band intensity, LOS velocity, field strength, and inclination. The time indicated in the bottom left corner corresponds to the instant when the SP slit was over the BSF. The thin blue contour outlines the BSF and corresponds to −0.2 km s-1. Panel numbers are shown in the top left corner. Five azimuthal cuts at different radial distances and indexed 1–5 are indicated in panel 1. The plot also shows two radial lines passing through the BSF and RSF.
Current usage metrics show cumulative count of Article Views (full-text article views including HTML views, PDF and ePub downloads, according to the available data) and Abstracts Views on Vision4Press platform.
Data correspond to usage on the plateform after 2015. The current usage metrics is available 48-96 hours after online publication and is updated daily on week days.
Initial download of the metrics may take a while.