Fig. 1
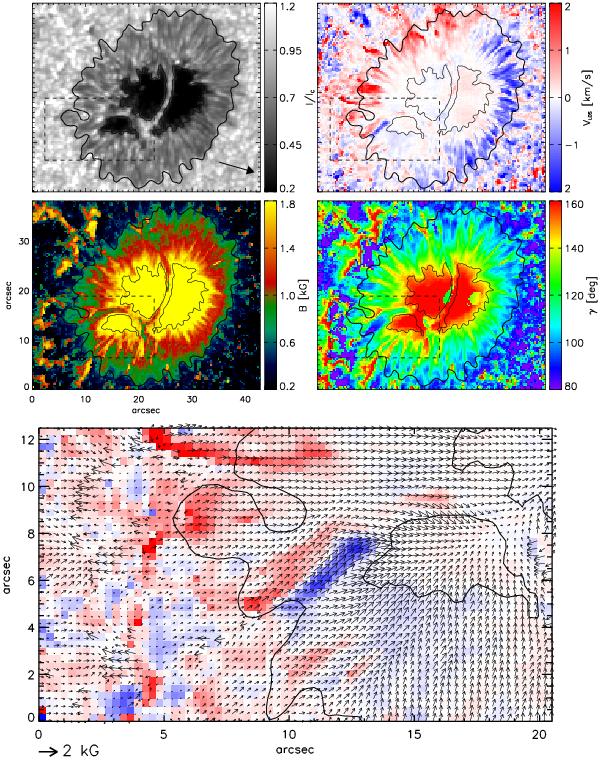
Leading sunspot in NOAA AR 11271. Top panels, clockwise from top left: G-band intensity, LOS velocity, field inclination in the local reference frame, and field strength. The MERLIN maps correspond to the last SP scan acquired from 10:05–10:21 UT. Blue and red colours in the LOS velocity map correspond to blue- and redshifts, respectively. The arrow in the top left panel points to disk centre. Bottom panel: arrows corresponding to the horizontal magnetic field overlaid on the LOS velocity map. The FOV under study is marked by the dashed rectangle in the top panels.
Current usage metrics show cumulative count of Article Views (full-text article views including HTML views, PDF and ePub downloads, according to the available data) and Abstracts Views on Vision4Press platform.
Data correspond to usage on the plateform after 2015. The current usage metrics is available 48-96 hours after online publication and is updated daily on week days.
Initial download of the metrics may take a while.