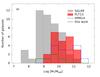
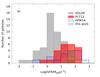
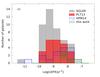
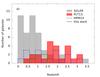
Fig. 4
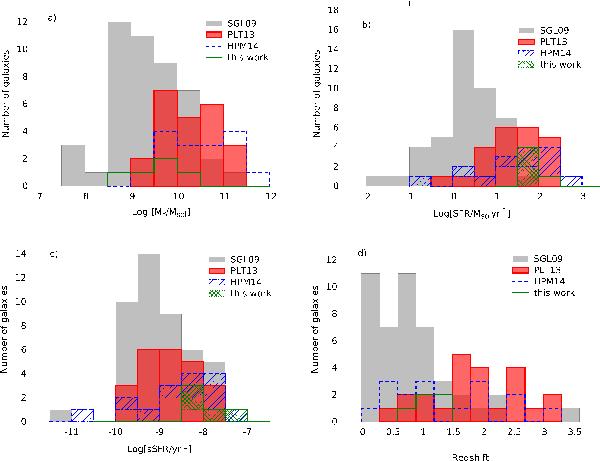
Distribution of logarithmic M∗ (top left), SFR (top right) and sSFR (bottom left) as derived from SED analysis, and the redshift distribution (bottom right) from a number of GRB host galaxy samples. Outlined in solid green is the sample in this paper, in dashed blue is the sample of 16 GRBHs from HPM14 (not including GRBH 070306), in filled red is a sample of 23 host galaxies of heavily dust-extinguished GRBs (AV,GRB> 1 mag) from PLT13, and the filled grey histogram is a sample of 46 host galaxies of optically bright GRBs from SGL09. The samples from HPM14 and this work include SFR and sSFR upper limits, which are shown in hashed blue, and in a crisscross green pattern, respectively.
Current usage metrics show cumulative count of Article Views (full-text article views including HTML views, PDF and ePub downloads, according to the available data) and Abstracts Views on Vision4Press platform.
Data correspond to usage on the plateform after 2015. The current usage metrics is available 48-96 hours after online publication and is updated daily on week days.
Initial download of the metrics may take a while.