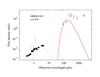
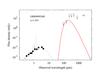
Fig. 3
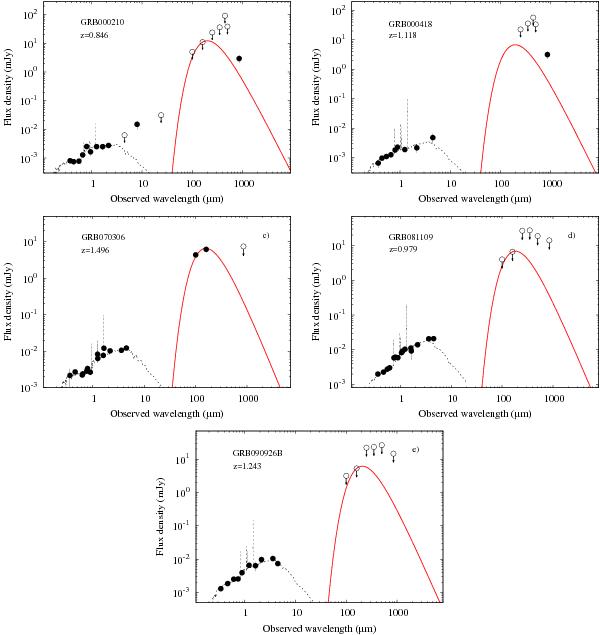
GRB host galaxy optical through to submm spectral energy distributions for our sample of five GRBHs observed with Herschel. Detections are plotted as filled symbols, and open circles represent 3σ upper limits. The lePHARE best-fit template galaxy models fitted to the optical to mid-IR data are shown (dashed black line), as well as our modified blackbody fits to the FIR and submm data (red solid line) (see Table 4 for details). In those cases where the host galaxy is not detected with Herschel, the modified blackbody fits are used to determine the upper limit on the corresponding dust mass and SFR.
Current usage metrics show cumulative count of Article Views (full-text article views including HTML views, PDF and ePub downloads, according to the available data) and Abstracts Views on Vision4Press platform.
Data correspond to usage on the plateform after 2015. The current usage metrics is available 48-96 hours after online publication and is updated daily on week days.
Initial download of the metrics may take a while.