Fig. 13
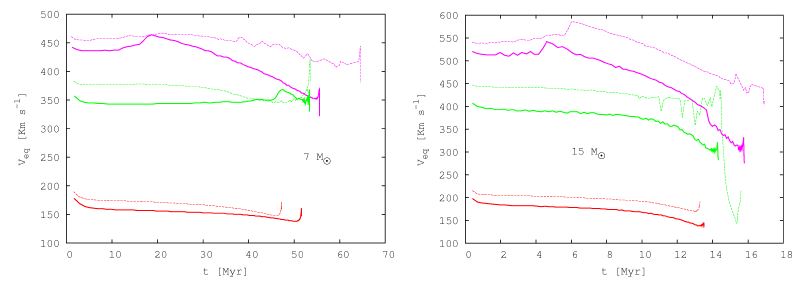
Evolution of the equatorial velocity through the MS phase for 7 M⊙ and 15 M⊙ models. Continuous lines correspond to Z = 0.014, whereas dashed lines correspond to Z = 0.002. Different colours indicate different values of Ω / Ωcrit at the ZAMS: red corresponds to 0.43, green to 0.83, and magenta to our new models with a large angular momentum content.
Current usage metrics show cumulative count of Article Views (full-text article views including HTML views, PDF and ePub downloads, according to the available data) and Abstracts Views on Vision4Press platform.
Data correspond to usage on the plateform after 2015. The current usage metrics is available 48-96 hours after online publication and is updated daily on week days.
Initial download of the metrics may take a while.