Fig. 1
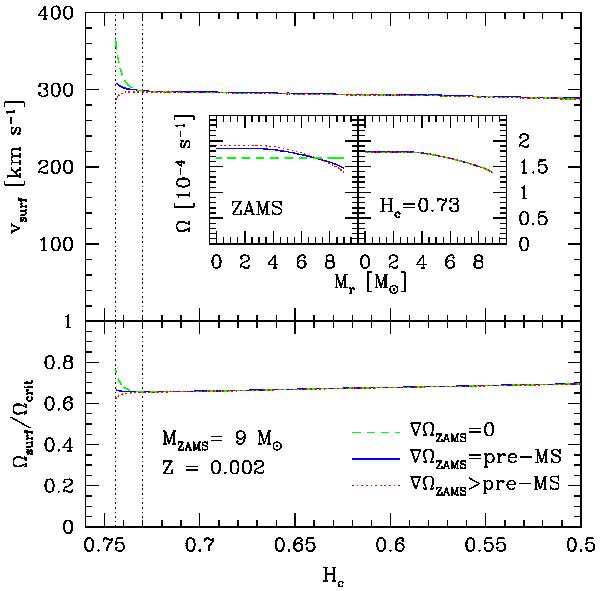
Evolution of the stellar rotation during the first part of the MS for the three models with 9 M⊙ and Z = 0.002 with the same value of Jtot, but with different rotation profiles on the ZAMS, as described in the text. Upper panel: equatorial rotational velocity as a function of the central mass fraction of hydrogen Hc. The internal rotation profiles on the ZAMS (Hc ≃ 0.744) and at Hc = 0.73 are superimposed. Lower panel: ratio of the surface angular velocity to the critical angular velocity as a function of the central mass fraction of hydrogen. In both panels, the two stages of the rotation profiles are indicated by vertical dotted lines.
Current usage metrics show cumulative count of Article Views (full-text article views including HTML views, PDF and ePub downloads, according to the available data) and Abstracts Views on Vision4Press platform.
Data correspond to usage on the plateform after 2015. The current usage metrics is available 48-96 hours after online publication and is updated daily on week days.
Initial download of the metrics may take a while.