Fig. 9
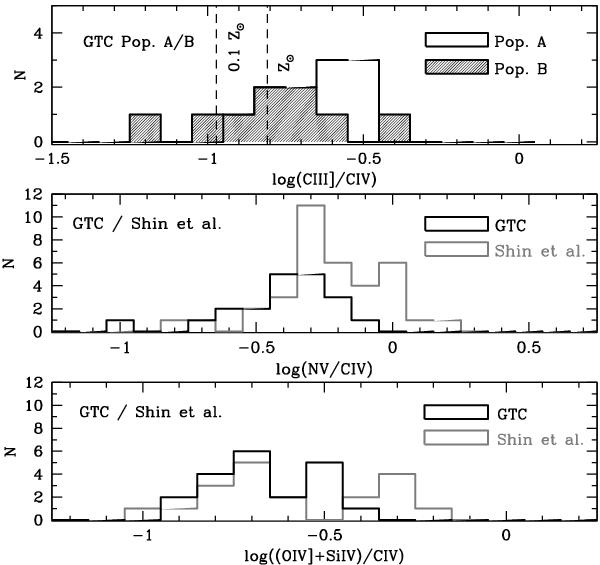
Distributions of Z-sensitive ratios. From top to bottom: Ciii]λ1909/Civλ1549 for the GTC sample (the dashed histogram is for population B). Dot-dashed lines trace the expected ratios for Z = 0.1 Z⊙ and Z = Z⊙ for log nH= 10 and log U = − 1.75. Middle: distribution of the ratio Nvλ1240/Civλ1549 for the GTC (black lines) and the Shin et al. (2013) low-z sample (gray lines), with the restriction log L ≥ 46.2 [erg s-1]. Bottom: the same for the ratio (Oiv]λ1402+Siivλ1397)/Civλ1549.
Current usage metrics show cumulative count of Article Views (full-text article views including HTML views, PDF and ePub downloads, according to the available data) and Abstracts Views on Vision4Press platform.
Data correspond to usage on the plateform after 2015. The current usage metrics is available 48-96 hours after online publication and is updated daily on week days.
Initial download of the metrics may take a while.