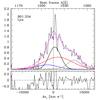
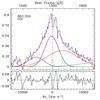
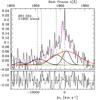
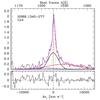
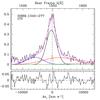
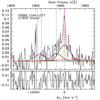
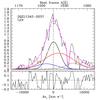
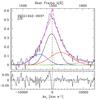
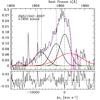
Fig. 5
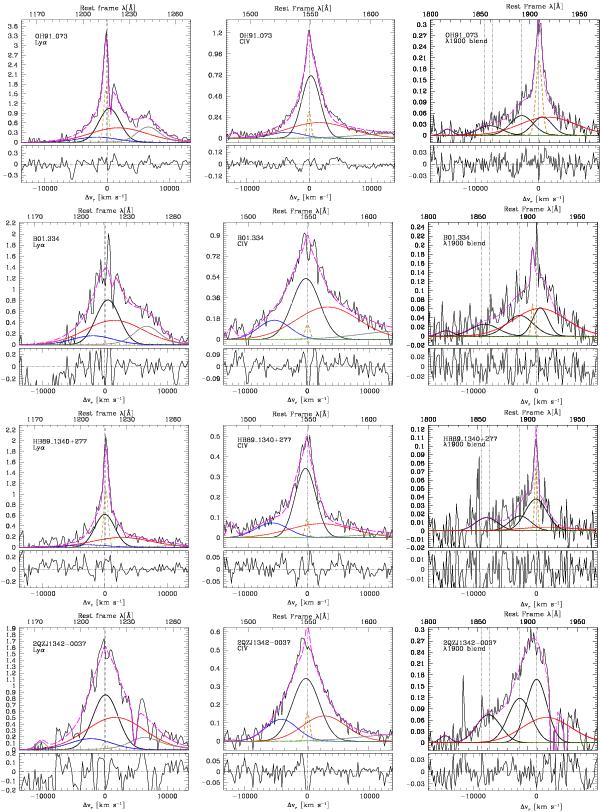
Results of the line-fit analysis on theLyα (left panel) Civλ1549 (middle) and 1900 Å emission features for population B sources. The meanings of symbols and colors is as in the previous figure. The VBC assumed to be present in the population B emission line profiles is traced by a thick red line.
Current usage metrics show cumulative count of Article Views (full-text article views including HTML views, PDF and ePub downloads, according to the available data) and Abstracts Views on Vision4Press platform.
Data correspond to usage on the plateform after 2015. The current usage metrics is available 48-96 hours after online publication and is updated daily on week days.
Initial download of the metrics may take a while.