Fig. B.4
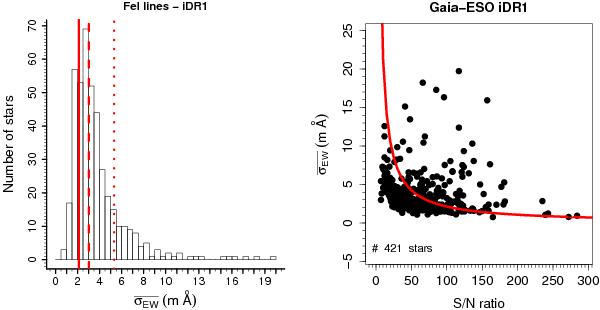
Left panel: histogram of  per star, taking into account the measurements of all Nodes. Also shown are lines indicating the 2σ uncertainty calculated with Cayrel (1988) formula for S/N = 40 (dotted line at 5.31 mÅ), S/N = 70 (dashed line at 3.04 mÅ), and S/N = 100 (solid line at 2.12 mÅ). Right panel: the dependence of with respect to S/N. Also shown is the expected 2σ value given by the Cayrel (1988) formula (as a red line).
Current usage metrics show cumulative count of Article Views (full-text article views including HTML views, PDF and ePub downloads, according to the available data) and Abstracts Views on Vision4Press platform.
Data correspond to usage on the plateform after 2015. The current usage metrics is available 48-96 hours after online publication and is updated daily on week days.
Initial download of the metrics may take a while.