Fig. 2
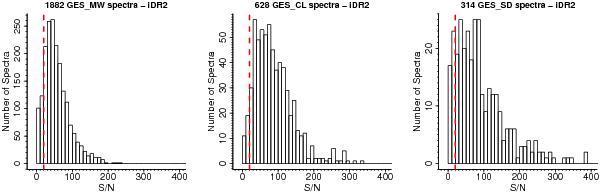
Distribution of the median S/N per pixel of the spectra observed with UVES that are part of iDR2 (1412 FGK-type stars). Each of the two UVES spectrum parts (from each CCD) is counted separately (thus, two spectra per star). The red dashed line indicates S/N = 20. The samples of the solar neighborhood (GES_MW), open clusters (GES_CL), and calibration targets (GES_SD) are shown separately. Only final stacked spectra were included in this plot; the single exposure spectra, even when analyzed, are not counted.
Current usage metrics show cumulative count of Article Views (full-text article views including HTML views, PDF and ePub downloads, according to the available data) and Abstracts Views on Vision4Press platform.
Data correspond to usage on the plateform after 2015. The current usage metrics is available 48-96 hours after online publication and is updated daily on week days.
Initial download of the metrics may take a while.