Free Access
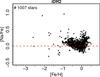
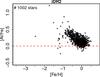
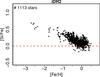
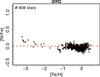
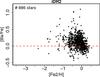
Fig. 17
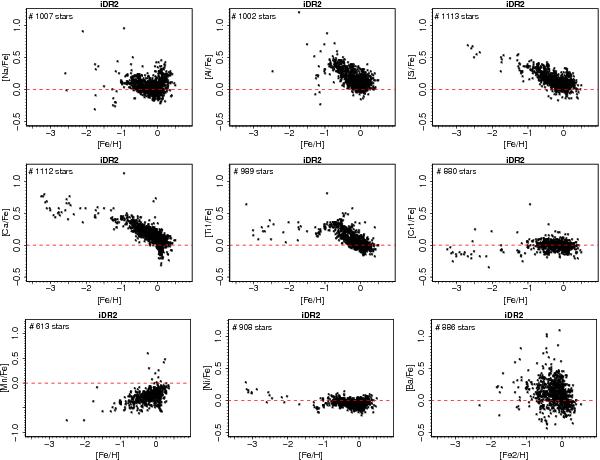
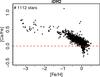
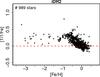
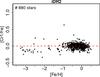
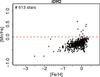
Abundances trends with metallicity for a few selected elements. Only results where the method-to-method dispersion is below 0.20 dex are plotted. Note that the Mn i plot has a different scale. All abundances shown are from the neutral species, except for the Ba plot, where Ba ii and Fe ii are used.
This figure is made of several images, please see below:
Current usage metrics show cumulative count of Article Views (full-text article views including HTML views, PDF and ePub downloads, according to the available data) and Abstracts Views on Vision4Press platform.
Data correspond to usage on the plateform after 2015. The current usage metrics is available 48-96 hours after online publication and is updated daily on week days.
Initial download of the metrics may take a while.