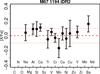
Fig. 16
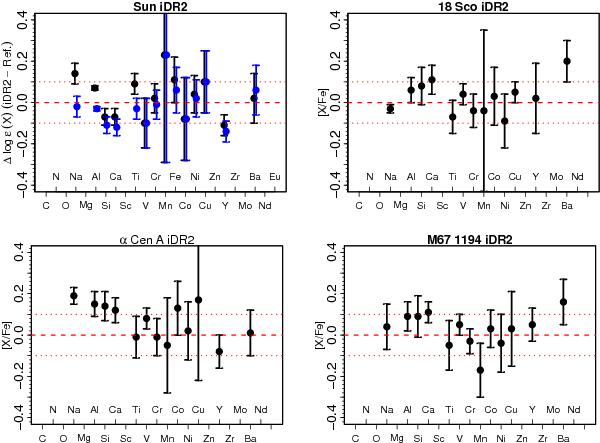
Abundance pattern of the Sun and selected solar analogs. Top left: the results for the FLAMES solar spectrum for which Teff = 5826 K, log g = 4.50, [Fe/H] = −0.03, and ξ = 1.05 km s-1 were derived. In black, the iDR2 results are compared to the solar abundances of Grevesse et al. (2007) and, in blue, to Grevesse & Sauval (1998). Top right: abundance pattern of the solar twin 18 Sco as derived here in comparison to the reference solar abundances computed in this work. For this star, the following atmospheric parameters were derived: Teff = 5782 K, log g = 4.39, [Fe/H] = 0.05, and ξ = 1.04 km s-1. Bottom left: abundance pattern of the solar analog α Cen A. The reference solar abundances are those derived here. For this star, the following atmospheric parameters were derived: Teff = 5781 K, log g = 4.26, [Fe/H] = 0.25, and ξ = 1.21 km s-1. Bottom right: abundance pattern of the solar twin in the M 67 open cluster, star YBP 1194, as derived here. The reference solar abundances are those derived here. For this star, the following atmospheric parameters were derived: Teff = 5759 K, log g = 4.41, [Fe/H] = −0.01, and ξ = 1.06 km s-1. In all plots, error bars are the method-to-method dispersion. Dashed lines represent Δlog ϵ(X) = 0.00 dex or [X/Fe] = 0.00 dex, dotted lines represent Δlog ϵ(X) = ±0.10 dex or [X/Fe] = ±0.10 dex. Abundances from this work are from the neutral species, except for Sc, Y, Zr, Ba, Nd, and Eu, for which the abundances are from the ionized species, and from C and N for which the abundances are from molecules.
Current usage metrics show cumulative count of Article Views (full-text article views including HTML views, PDF and ePub downloads, according to the available data) and Abstracts Views on Vision4Press platform.
Data correspond to usage on the plateform after 2015. The current usage metrics is available 48-96 hours after online publication and is updated daily on week days.
Initial download of the metrics may take a while.