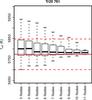
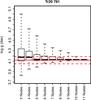
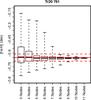
Fig. 15
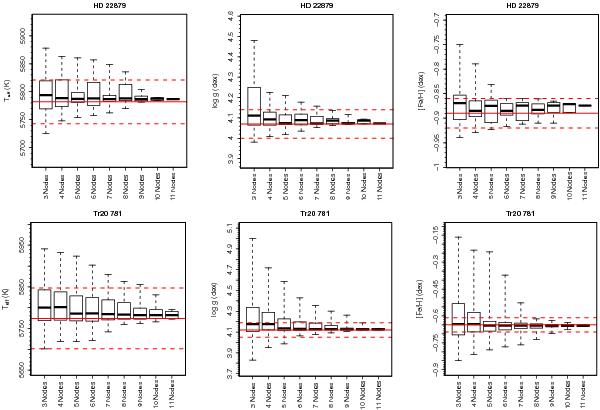
Histograms of the median values of randomly selected Node results. These histograms display the effect on the recommended parameters caused by changing the number of Nodes that contribute to the final value (see text for full explanation). Red solid lines indicate the final recommended parameter, red dashed lines indicate the final 1σ method-to-method dispersion. The top panels show the case of HD 22879, the bottom panels the case of Tr20 781. In each boxplot, the thicker solid line indicates the median of the distribution, the box extends from the first to the third quartile, and the dashed lines extend to the extreme values.
Current usage metrics show cumulative count of Article Views (full-text article views including HTML views, PDF and ePub downloads, according to the available data) and Abstracts Views on Vision4Press platform.
Data correspond to usage on the plateform after 2015. The current usage metrics is available 48-96 hours after online publication and is updated daily on week days.
Initial download of the metrics may take a while.