Fig. 14
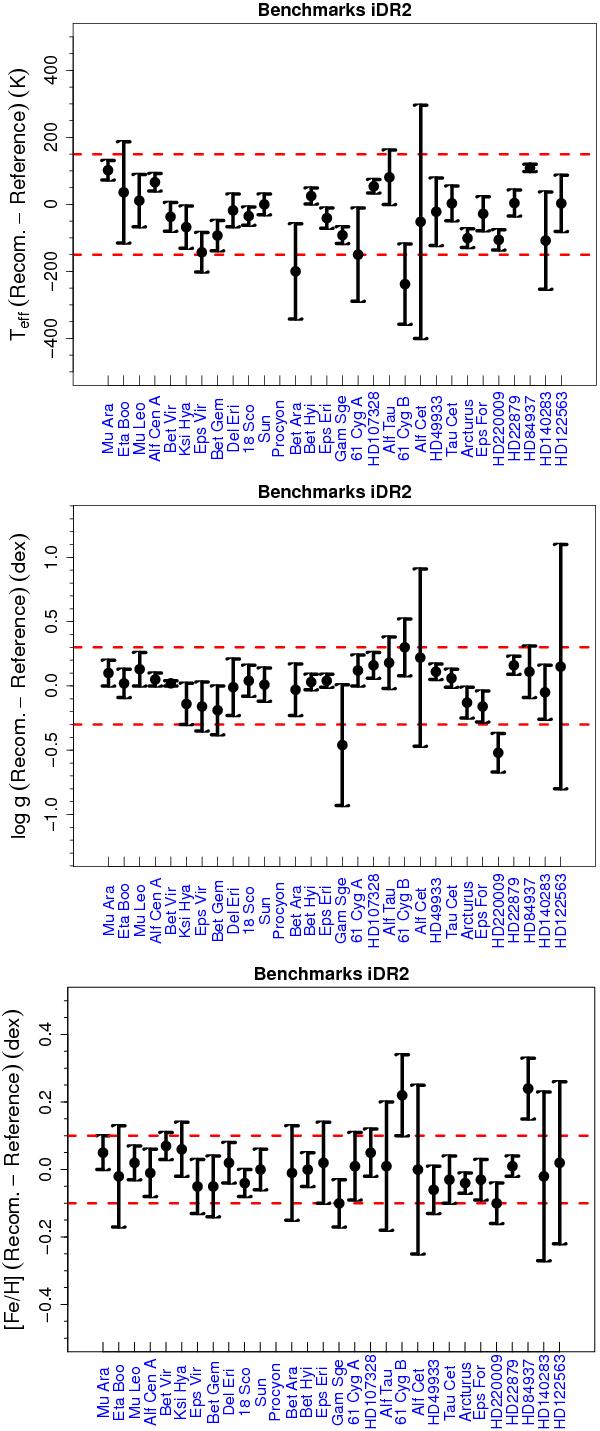
Difference between the recommended values of Teff, log g, and [Fe/H] for the benchmark stars of iDR2 and the reference values. The error bars are the method-to-method dispersions. The stars are sorted in order of decreasing [Fe/H] (left to right). The dashed red lines indicate limits of ±150 K for Teff, of ±0.30 dex for log g, and of ±0.10 dex for [Fe/H].
Current usage metrics show cumulative count of Article Views (full-text article views including HTML views, PDF and ePub downloads, according to the available data) and Abstracts Views on Vision4Press platform.
Data correspond to usage on the plateform after 2015. The current usage metrics is available 48-96 hours after online publication and is updated daily on week days.
Initial download of the metrics may take a while.