Free Access
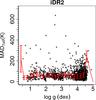
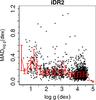
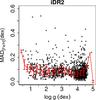
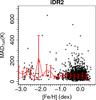
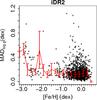
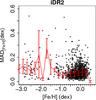
Fig. 13
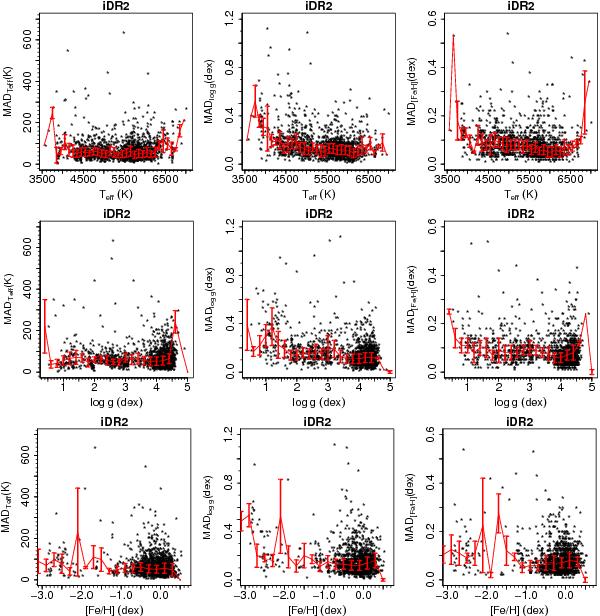
Dependency of the method-to-method dispersion with respect to the atmospheric parameters of the stars. The red line connects the median value in each bin of 100 K (top row), 0.20 dex (middle row), and 0.20 dex (bottom row). The error bars in the line represent the median absolute deviation.
This figure is made of several images, please see below:
Current usage metrics show cumulative count of Article Views (full-text article views including HTML views, PDF and ePub downloads, according to the available data) and Abstracts Views on Vision4Press platform.
Data correspond to usage on the plateform after 2015. The current usage metrics is available 48-96 hours after online publication and is updated daily on week days.
Initial download of the metrics may take a while.