Free Access
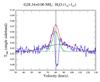
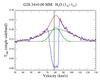
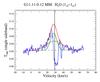
Fig. 4

Water emission seen in three clumps . Emission lines are fit with two Gaussian components (solid green). The continuum is a first order polynomial fit (dashed green). The total emission is the sum of the two components and the continuum (shown in red).
This figure is made of several images, please see below:
Current usage metrics show cumulative count of Article Views (full-text article views including HTML views, PDF and ePub downloads, according to the available data) and Abstracts Views on Vision4Press platform.
Data correspond to usage on the plateform after 2015. The current usage metrics is available 48-96 hours after online publication and is updated daily on week days.
Initial download of the metrics may take a while.