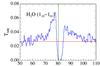
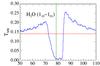
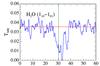
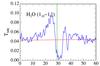
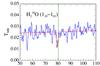
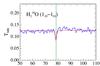
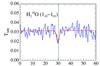
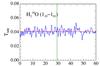
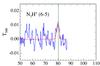
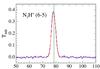
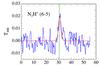
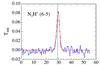
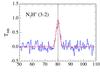
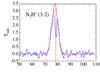
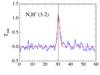
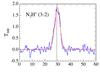
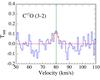
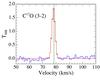
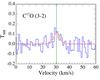
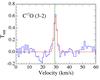
Fig. 3

Data for HIFI and APEX (C17O and N2H+) observations for each clump and transition are shown in blue. Gaussian fits are indicated in red except for the water transition where only the continuum level is shown in red. The systemic velocity of each clump is indicated with a green line. The complex profiles of the main H2O line are clearly visible. The full model decompositions of both emission and absorption are shown in Figs. 4 and 5 respectively.
Current usage metrics show cumulative count of Article Views (full-text article views including HTML views, PDF and ePub downloads, according to the available data) and Abstracts Views on Vision4Press platform.
Data correspond to usage on the plateform after 2015. The current usage metrics is available 48-96 hours after online publication and is updated daily on week days.
Initial download of the metrics may take a while.