Fig. 1
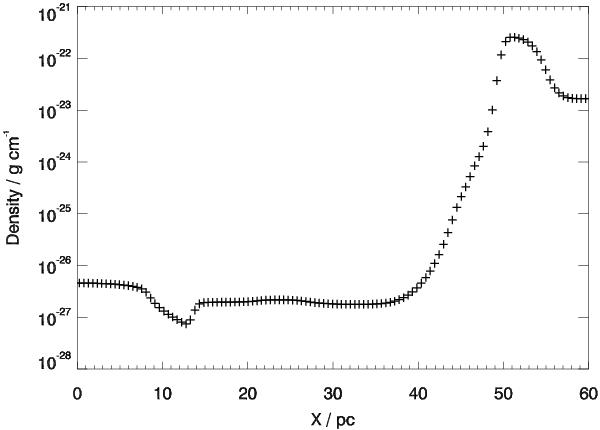
This figure replaces Fig. 2 of the original publication. It shows the run of the density on a linear slice along the positive X-axis for run 3S1-hr at time 4.598 Myr, i.e. 2139 yr before the central most massive star (at X = 0) explodes. Each “+”-Symbol shows the value of the density in one grid cell. The mixing region is resolved with about 20 cells, and extends from 40 to 50 pc.
Current usage metrics show cumulative count of Article Views (full-text article views including HTML views, PDF and ePub downloads, according to the available data) and Abstracts Views on Vision4Press platform.
Data correspond to usage on the plateform after 2015. The current usage metrics is available 48-96 hours after online publication and is updated daily on week days.
Initial download of the metrics may take a while.