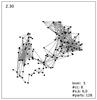
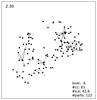
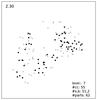
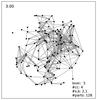
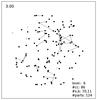
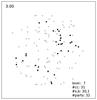
Fig. 1
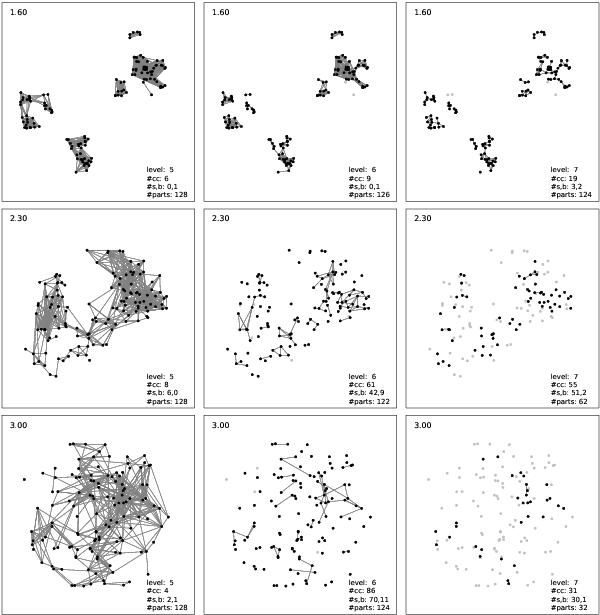
Time step graphs generated by τ(i,j) at different levels of the time step hierarchy (left to right) for three values (top to bottom rows) of the fractal dimension. We plot particles that have been passed on as a part of a connected component from the previous time step level as black, grey points indicate points that are inactive on a given level (because they formed a single or binary component at a lower level). Thin grey lines indicate interactions with τ(i,j) <h. Indicated in each frame are the fractal dimension (top left), and (on the bottom right) the level in the hierarchy, the number of connected components (cc) at this level, as well as the number of components that are single (s) and binary (b), and the total number of particles.
Current usage metrics show cumulative count of Article Views (full-text article views including HTML views, PDF and ePub downloads, according to the available data) and Abstracts Views on Vision4Press platform.
Data correspond to usage on the plateform after 2015. The current usage metrics is available 48-96 hours after online publication and is updated daily on week days.
Initial download of the metrics may take a while.