Fig. 5
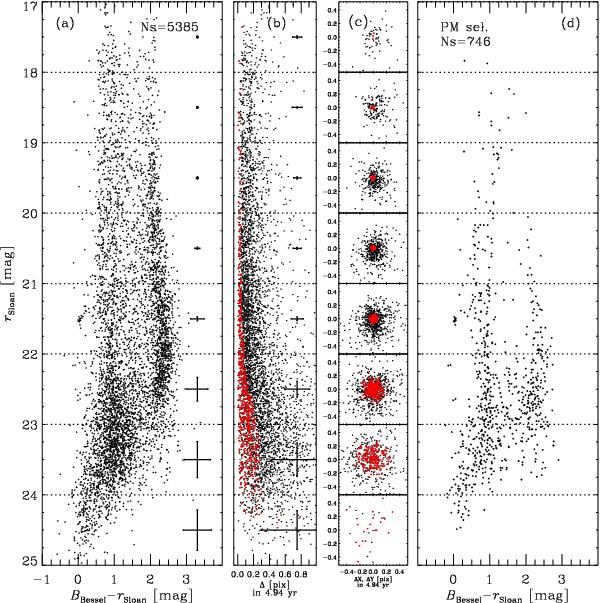
Panel a)rSloan vs. BBessel − rSloan CMD-cleaned, according to the photometric selection criteria described in the text. Mean errors are also shown on the right for each magnitude bin. Panel b) Displacement based on the rSloan -filter as a function of magnitude. Mean errors are also shown. Red symbols mark proper-motion (PM) selected stars (see text). Panels c) Vector-point diagrams for each magnitude bin. Symbols are the same as in panel b). Panel d): rSloan vs. BBessel − rSloan PM-selected CMD.
Current usage metrics show cumulative count of Article Views (full-text article views including HTML views, PDF and ePub downloads, according to the available data) and Abstracts Views on Vision4Press platform.
Data correspond to usage on the plateform after 2015. The current usage metrics is available 48-96 hours after online publication and is updated daily on week days.
Initial download of the metrics may take a while.