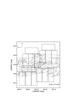
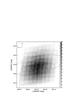
Fig. 1

Left: map of Hercules UFD showing the regions covered by the proprietary and archive LBT observations used in the present study. The solid lines display the contours of the most external LBC pointings of the dither pattern adopted during the April 2013 observations. The black points show the position of the photometric sources in the central and lateral fields observed by Sand et al. (2009). Symbol size is inversely proportional to the source rSloan magnitude. The solid and dashed ellipses mark the galaxy half-light and tidal radii, respectively. Right: footprints of the 5 × 5 dither pattern adopted during the April 2013 observations. The depth-of-coverage map for the rSloan -images is also shown in grey scale.
Current usage metrics show cumulative count of Article Views (full-text article views including HTML views, PDF and ePub downloads, according to the available data) and Abstracts Views on Vision4Press platform.
Data correspond to usage on the plateform after 2015. The current usage metrics is available 48-96 hours after online publication and is updated daily on week days.
Initial download of the metrics may take a while.