Fig. 9
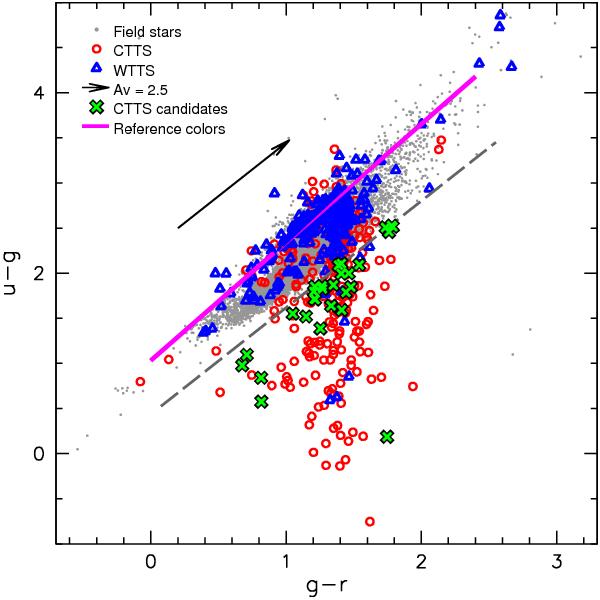
Selection of new CTTS candidates from the (g − r, u − g) diagram. The gray dashed line traces a conservative boundary separating the accretion-dominated region of the diagram from the color locus of non-accreting stars (see text). Field stars, WTTS and known CTTS are depicted as gray dots, blue triangles and red circles, respectively; the new CTTS candidates selected from this diagram are marked as green crosses. The purple line fitting the upper envelope of the WTTS distribution traces the reference sequence of photospheric colors that has been adopted for measuring the UV excess of accreting stars (see Sect. 4).
Current usage metrics show cumulative count of Article Views (full-text article views including HTML views, PDF and ePub downloads, according to the available data) and Abstracts Views on Vision4Press platform.
Data correspond to usage on the plateform after 2015. The current usage metrics is available 48-96 hours after online publication and is updated daily on week days.
Initial download of the metrics may take a while.