Free Access
Fig. 8
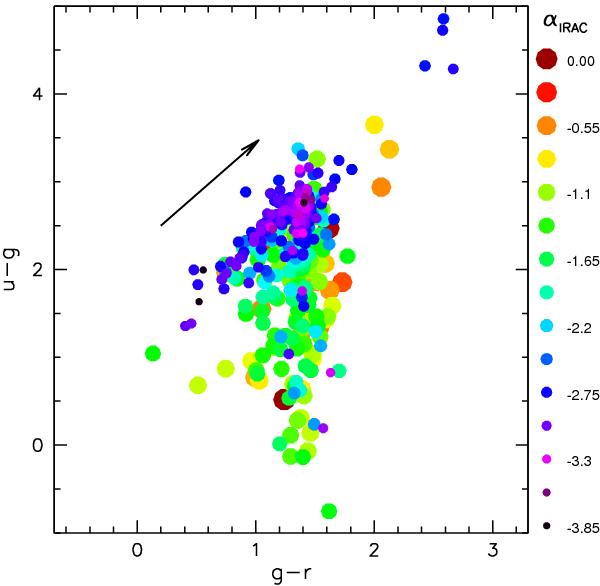
u − g vs. g − r colors for NGC 2264 members are compared to the αIRAC diagnostics, which probes the inner disk properties (see text). Colors and sizes of symbols are scaled according to the value of αIRAC from the data of Teixeira et al. (2012).
Current usage metrics show cumulative count of Article Views (full-text article views including HTML views, PDF and ePub downloads, according to the available data) and Abstracts Views on Vision4Press platform.
Data correspond to usage on the plateform after 2015. The current usage metrics is available 48-96 hours after online publication and is updated daily on week days.
Initial download of the metrics may take a while.