Fig. 21
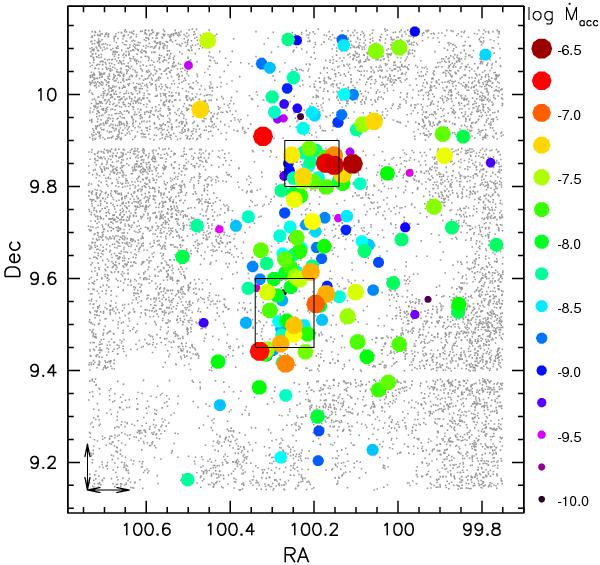
Spatial mapping of accretion properties in NGC 2264. Small gray dots indicate the distribution of field stars, large dots indicate accreting cluster members. Only objects with an actual Ṁacc detection are shown. Symbol colors and sizes are scaled according to the value of Ṁacc. The black boxes mark the regions of maximum stellar density in the cluster (from Lamm et al. 2004). Double arrows mark a physical distance of 1.5 parsecs.
Current usage metrics show cumulative count of Article Views (full-text article views including HTML views, PDF and ePub downloads, according to the available data) and Abstracts Views on Vision4Press platform.
Data correspond to usage on the plateform after 2015. The current usage metrics is available 48-96 hours after online publication and is updated daily on week days.
Initial download of the metrics may take a while.