Fig. 18
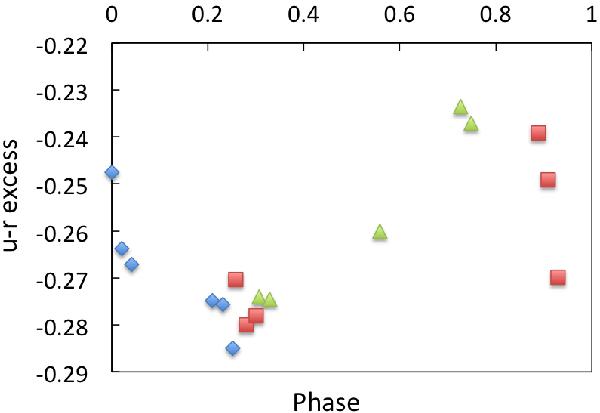
Phased diagram of the variability of the UV excess monitored over a baseline varying from a few hours to a few rotational cycles for an NGC 2264 accreting member (M∗ = 1.13 M⊙; Ṁacc = 5.98 × 10⁻⁹ M⊙/yr; Prot = 4.767 days, from Affer et al. 2013). The phase is computed starting from the epoch of the first measurement; the UV excess at each epoch is computed as described in Eq. (9). Different symbols correspond to different rotational cycles.
Current usage metrics show cumulative count of Article Views (full-text article views including HTML views, PDF and ePub downloads, according to the available data) and Abstracts Views on Vision4Press platform.
Data correspond to usage on the plateform after 2015. The current usage metrics is available 48-96 hours after online publication and is updated daily on week days.
Initial download of the metrics may take a while.