Fig. 17
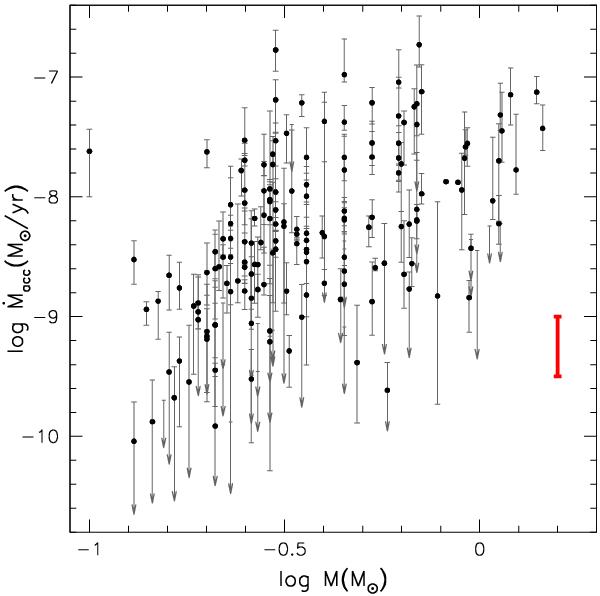
Variability of the mass accretion rates observed for NGC 2264 members over the 2-week long CFHT monitoring. Black dots correspond to the median Ṁacc measured for each object (see Fig. 16). For each object, the relevant variability bar is displayed, corresponding to the difference between the maximum and the minimum Ṁacc detected during the monitoring. A typical variability bar is shown in red.
Current usage metrics show cumulative count of Article Views (full-text article views including HTML views, PDF and ePub downloads, according to the available data) and Abstracts Views on Vision4Press platform.
Data correspond to usage on the plateform after 2015. The current usage metrics is available 48-96 hours after online publication and is updated daily on week days.
Initial download of the metrics may take a while.