Fig. 15
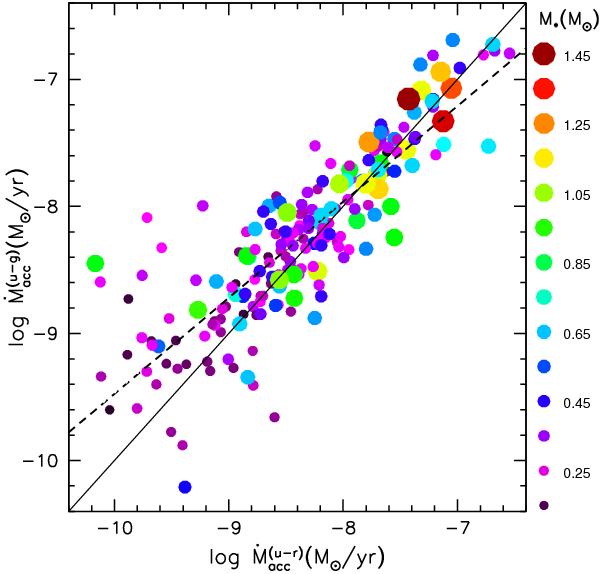
Ṁacc values obtained with the two methods described in the text. Ṁacc values on the y-axis are inferred from ugr snapshot photometry, while Ṁacc values on the x-axis correspond to the median UV excess detected during the ur monitoring. Colors and sizes of symbols are scaled according to stellar mass M∗. The solid line marks the equality line; the linear regression to the point distribution is traced as a dashed line.
Current usage metrics show cumulative count of Article Views (full-text article views including HTML views, PDF and ePub downloads, according to the available data) and Abstracts Views on Vision4Press platform.
Data correspond to usage on the plateform after 2015. The current usage metrics is available 48-96 hours after online publication and is updated daily on week days.
Initial download of the metrics may take a while.