Fig. 13
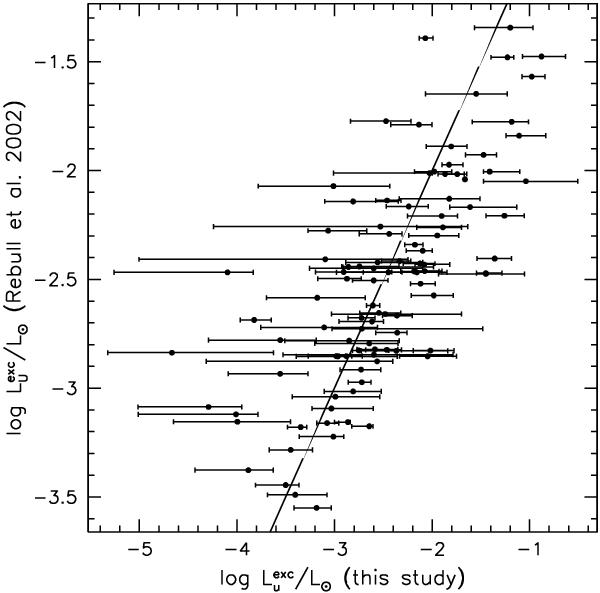
UV excess luminosity measurements obtained in this study are compared to Rebull et al. (2002)’s for objects in common to
both samples (Rebull, priv. comm.). On the x-axis, dots correspond to the median
 detected during the 2 week-long CFHT monitoring, while variability bars depict the
actual range in values
measured at different observing epochs during the survey. The equality line is traced
as a solid line to guide the eye.
detected during the 2 week-long CFHT monitoring, while variability bars depict the
actual range in values
measured at different observing epochs during the survey. The equality line is traced
as a solid line to guide the eye.
Current usage metrics show cumulative count of Article Views (full-text article views including HTML views, PDF and ePub downloads, according to the available data) and Abstracts Views on Vision4Press platform.
Data correspond to usage on the plateform after 2015. The current usage metrics is available 48-96 hours after online publication and is updated daily on week days.
Initial download of the metrics may take a while.