Fig. 9
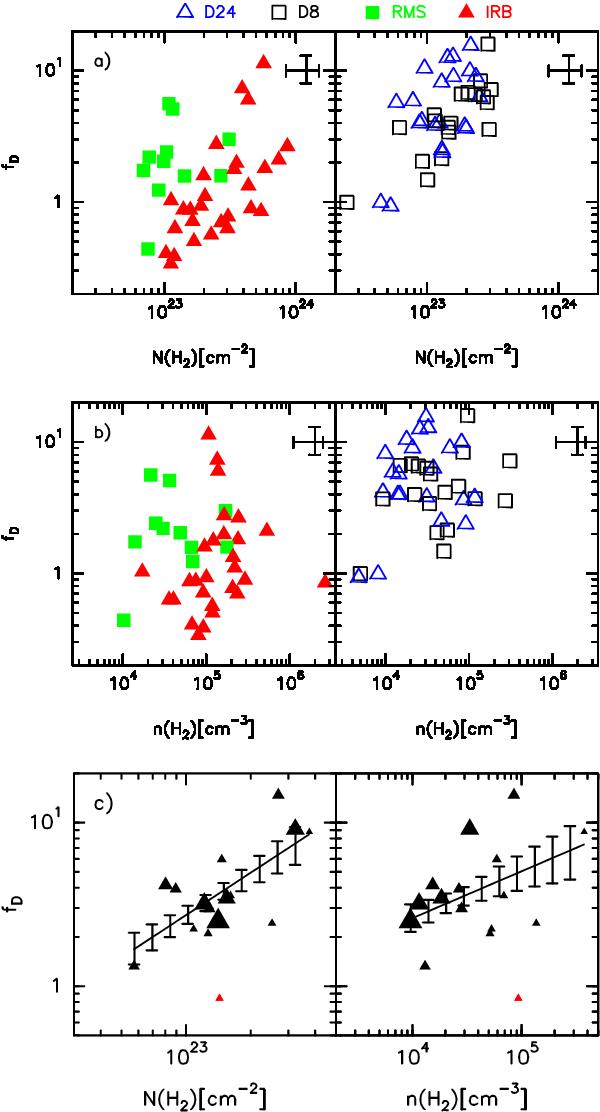
Panel a) shows the CO depletion factor (from  ) as a function of N(H2). Each group of sources is shown with a different symbol and colour, as indicated. Panel b) is the same as a), but for fD as a function of n(H2). Panel c) shows that removing the Tex-dependence the trends are still visible (see text). The solid lines are simple non-parametric regressions made using the R (R Core Team 2014) np package (Hayfield & Racine 2008) (excluding the outlier indicated in red); bootstrapped errors are indicated. Symbol sizes are proportional to the distance of the source.
Current usage metrics show cumulative count of Article Views (full-text article views including HTML views, PDF and ePub downloads, according to the available data) and Abstracts Views on Vision4Press platform.
Data correspond to usage on the plateform after 2015. The current usage metrics is available 48-96 hours after online publication and is updated daily on week days.
Initial download of the metrics may take a while.