Fig. 8
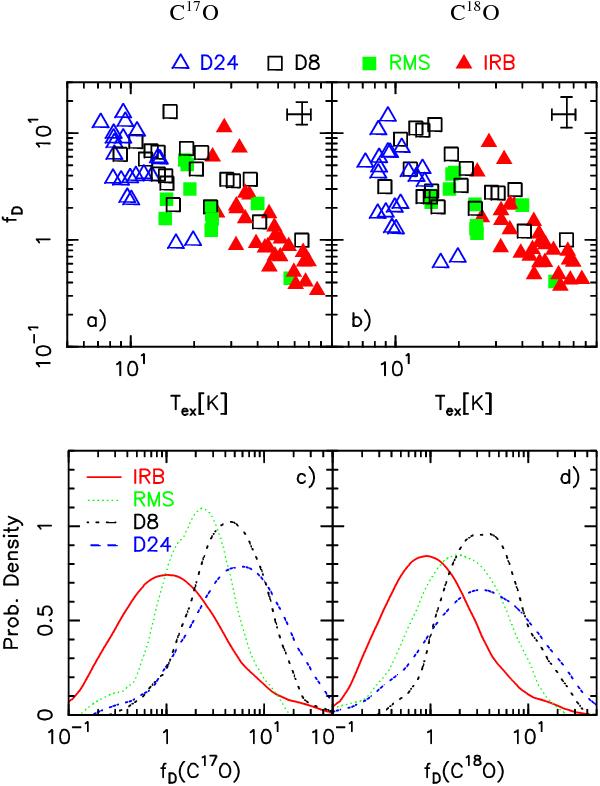
Panels a) and b) show CO depletion factors from  and
and  as a function of Tex, respectively. A typical uncertainty is shown in the top right corner. Each group of sources is shown with a different symbol and colour, as indicated. Panels c) and d) show the kernel density estimates for the depletion factors, from and , respectively.
Current usage metrics show cumulative count of Article Views (full-text article views including HTML views, PDF and ePub downloads, according to the available data) and Abstracts Views on Vision4Press platform.
Data correspond to usage on the plateform after 2015. The current usage metrics is available 48-96 hours after online publication and is updated daily on week days.
Initial download of the metrics may take a while.