Fig. 6
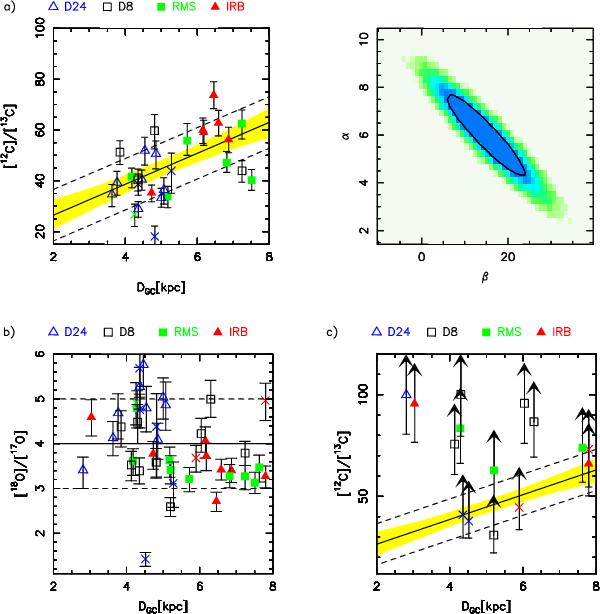
Ratio of different CO isotopologues as a function of Galactocentric radius, as determined from the procedure described in Sect. 4.4. Each group of sources is shown with a different symbol and colour, as indicated. Velocity components different from the main one are indicated with crosses; the colour of the cross refers to the main component classification. In a) we show [12C]/[13C] for the sources detected in  . The black solid line is the best fit, the yellow-shaded area in the left panel indicates the 68% uncertainty, and the dashed lines show the intrinsic scatter of the relation. In the right panel we show the joint probability distribution of the parameters of the fit (y = αx + β); in black we indicate the 68% contour. Panel b) is the same as the left panel in a), for [18O]/[17O]. Panel c) shows [12C]/[13C] for the sources undetected in (see text). We show again the fit from the left panel in a) for clarity.
Current usage metrics show cumulative count of Article Views (full-text article views including HTML views, PDF and ePub downloads, according to the available data) and Abstracts Views on Vision4Press platform.
Data correspond to usage on the plateform after 2015. The current usage metrics is available 48-96 hours after online publication and is updated daily on week days.
Initial download of the metrics may take a while.